Import Dynamic Data
Longitudinal (also called dynamic) networks are simply networks that evolve chronologically. If you imagine the network of your friends, the number of nodes, connections and attribute values grow and change as time passes. We call these dynamic attributes, because they have values associated with a particular moment.
Longitudinal Networks
Gephi supports two fundamental ways to represent time in dynamic networks:
- Timestamps: Discrete points in time (e.g., specific dates or moments)
- Intervals: Time ranges with start and end bounds (e.g., periods of existence)
These two time representations cannot be mixed within the same graph - you must choose one or the other for your entire network.
For example with Intervals:
Imagine a network of three nodes for the years 2007, 2008 and 2009. When using intervals, nodes exist for a duration between a start and end time.

The second node, 'n2', is present during all three years and is represented by brackets enclosing the first and last years [2007, 2009]. Gephi automatically includes any dates, such as 2008, within this range. The first node, 'n1', however, is closed with a parenthesis rather than a bracket. This means the node was present in 2008 but NOT in 2009.
Technically speaking, brackets are used for closed (also known as inclusive) intervals, while parentheses represent open intervals. In other words, dates enclosed within two brackets include both the startpoint and endpoint, whereas dates enclosed within two parentheses begins after the startpoint and ends before the endpoint. Half-closed intervals that incorporate both, like the [2007, 2009) example above, are also possible.
For example with Timestamps:
With timestamps, nodes exist at specific discrete points in time. For instance, if nodes appear at years 2007, 2008, and 2009, each would have a specific timestamp value rather than a range. This is useful when you have snapshot data where each observation represents a distinct moment.
Check the Data Laboratory to see how time is represented for each node or edge. When the network is longitudinal, a Time Interval column is present that shows when elements exist in the graph. You can visualize this by clicking the checkbox next to 'Time intervals as graphics' in the Configuration tab of the Data Laboratory. After enabling the timeline, be sure to adjust the size of the window of the sliding filter of your timeline, otherwise you will receive an error stating that Gephi "cannot animate timeline without an animation interval."
Import from GEXF File
The GEXF format includes everything needed to represent longitudinal networks with both timestamps and intervals. You define a single network and configure how time is represented.
Time Representation and Time Format
GEXF supports two key attributes for configuring time:
- timerepresentation: Choose between
"interval"(default) or"timestamp" - timeformat: Choose between
"double"(default),"date"(yyyy-mm-dd), or"dateTime"(ISO 8601 format with optional timezone)
These attributes are set on the <graph> element and apply to the entire network. Remember: you cannot mix timestamp and interval representations in the same file.
Basic example with Intervals
Below is an example with three nodes from 2007 to 2009, using interval representation with date format.
<?xml version="1.0" encoding="UTF-8"?>
<gexf xmlns="http://gexf.net/1.3"
       xmlns:xsi="http://www.w3.org/2001/XMLSchema-instance"
       xsi:schemaLocation="http://gexf.net/1.3
                             http://gexf.net/1.3/gexf.xsd"
      version="1.3">
  <graph mode="dynamic" timerepresentation="interval" timeformat="date" defaultedgetype="directed">
    <nodes>
      <node id="n1" label="Node 1" start="2007-01-01" end="2008-12-31" />
      <node id="n2" label="Node 2" start="2007-01-01" end="2009-12-31" />
      <node id="n3" label="Node 3" start="2008-01-01" end="2009-12-31" />
    </nodes>
    <edges>
      <edge source="n1" target="n2" start="2007-01-01" end="2008-12-31" />
      <edge source="n1" target="n3" start="2008-01-01" end="2008-12-31"/>
      <edge source="n3" target="n2" start="2008-01-01" end="2009-12-31"/>
    </edges>
  </graph>
</gexf>
Important points for intervals:
- Set mode="dynamic" on the graph element (required for dynamic networks)
- Set timerepresentation="interval" (or omit it, as interval is the default)
- Use start and end attributes on nodes and edges to define when they exist
- Both start and end values are inclusive in GEXF 1.3
- Omitting start or end creates infinity bounds (e.g., only
start="2007-01-01"means [2007-01-01, +infinity]) - Edges must exist within the time bounds of their source and target nodes
Basic example with Timestamps
Here's the same network using timestamp representation:
<?xml version="1.0" encoding="UTF-8"?>
<gexf xmlns="http://gexf.net/1.3"
       xmlns:xsi="http://www.w3.org/2001/XMLSchema-instance"
       xsi:schemaLocation="http://gexf.net/1.3
                             http://gexf.net/1.3/gexf.xsd"
      version="1.3">
  <graph mode="dynamic" timerepresentation="timestamp" timeformat="date" defaultedgetype="directed">
    <nodes>
      <node id="n1" label="Node 1" timestamp="2007-01-01" />
      <node id="n2" label="Node 2" timestamp="2007-01-01" />
      <node id="n3" label="Node 3" timestamp="2008-01-01" />
    </nodes>
    <edges>
      <edge source="n1" target="n2" timestamp="2007-01-01" />
      <edge source="n1" target="n3" timestamp="2008-01-01"/>
      <edge source="n3" target="n2" timestamp="2008-01-01"/>
    </edges>
  </graph>
</gexf>
Important points for timestamps:
- Set timerepresentation="timestamp" on the graph element (required for timestamp mode)
- Use timestamp attribute on nodes and edges (not start/end)
- Each element exists at a specific point in time
- Use spells (see below) if an element needs to exist at multiple timestamps
The GEXF specifications, including dynamics, are available in the GEXF Primer.
Dynamic attributes
The examples above described how to represent the network topology over time, where nodes and edges are added or removed. Now let's see how to represent attribute values changing over time, for example 'Price'.
Dynamic attributes with Intervals
<?xml version="1.0" encoding="UTF-8"?>
<gexf xmlns="http://gexf.net/1.3"
      xmlns:xsi="http://www.w3.org/2001/XMLSchema-instance"
      xsi:schemaLocation="http://gexf.net/1.3
                          http://gexf.net/1.3/gexf.xsd"
      version="1.3">
  <graph mode="dynamic" timerepresentation="interval" timeformat="date" defaultedgetype="directed">
    <attributes class="node">
      <attribute id="price" title="Price" type="float"/>
    </attributes>
    <nodes>
      <node id="n1" label="Node 1" start="2007-01-01" end="2008-12-31">
        <attvalues>
          <attvalue for="price" value="25.5" start="2007-01-01" end="2007-12-31"/>
          <attvalue for="price" value="42.5" start="2008-01-01" end="2008-12-31"/>
        </attvalues>
      </node>
      <node id="n2" label="Node 2" start="2007-01-01" end="2009-12-31">
        <attvalues>
          <attvalue for="price" value="12.0" start="2008-01-01"/>
        </attvalues>
      </node>
      <node id="n3" label="Node 3" start="2008-01-01" end="2009-12-31">
        <attvalues>
          <attvalue for="price" value="40.5" start="2008-01-01" end="2009-12-31" />
        </attvalues>
      </node>
    </nodes>
    <edges>
      <edge source="n1" target="n2" start="2007-01-01" end="2008-12-31"/>
      <edge source="n1" target="n3" start="2008-01-01" end="2008-12-31"/>
      <edge source="n3" target="n2" start="2008-01-01" end="2009-12-31"/>
    </edges>
  </graph>
</gexf>
Dynamic attributes with Timestamps
<?xml version="1.0" encoding="UTF-8"?>
<gexf xmlns="http://gexf.net/1.3"
      xmlns:xsi="http://www.w3.org/2001/XMLSchema-instance"
      xsi:schemaLocation="http://gexf.net/1.3
                          http://gexf.net/1.3/gexf.xsd"
      version="1.3">
  <graph mode="dynamic" timerepresentation="timestamp" timeformat="date" defaultedgetype="directed">
    <attributes class="node">
      <attribute id="price" title="Price" type="float"/>
    </attributes>
    <nodes>
      <node id="n1" label="Node 1" timestamp="2007-01-01">
        <attvalues>
          <attvalue for="price" value="25.5" timestamp="2007-01-01"/>
          <attvalue for="price" value="42.5" timestamp="2008-01-01"/>
        </attvalues>
      </node>
      <node id="n2" label="Node 2" timestamp="2007-01-01">
        <attvalues>
          <attvalue for="price" value="10.0" timestamp="2007-01-01"/>
          <attvalue for="price" value="12.0" timestamp="2008-01-01"/>
        </attvalues>
      </node>
      <node id="n3" label="Node 3" timestamp="2008-01-01">
        <attvalues>
          <attvalue for="price" value="40.5" timestamp="2008-01-01" />
        </attvalues>
      </node>
    </nodes>
    <edges>
      <edge source="n1" target="n2" timestamp="2007-01-01"/>
      <edge source="n1" target="n3" timestamp="2008-01-01"/>
      <edge source="n3" target="n2" timestamp="2008-01-01"/>
    </edges>
  </graph>
</gexf>
Keep in mind:
- To represent several values over time, repeat the same attvalue element with different time bounds and values
- It's not mandatory to set a value for all time periods; if missing, the default value is used
- For intervals: if no end is specified, the value extends to infinity (e.g., [2008-01-01, +infinity])
- For timestamps: each attvalue represents the value at that specific point in time
- Attribute values must fall within the time bounds of their parent element (node or edge)
The GEXF specifications, including dynamics attributes, are available in the GEXF Primer.
Spells: Multiple time periods for elements
If a node or edge needs to exist at multiple non-contiguous time periods, use the <spells> element. This works with both interval and timestamp representations.
Spells with Intervals
<?xml version="1.0" encoding="UTF-8"?>
<gexf xmlns="http://gexf.net/1.3" version="1.3">
  <graph mode="dynamic" timerepresentation="interval" timeformat="date">
    <nodes>
      <node id="n1" label="Node 1">
        <spells>
          <spell start="2007-01-01" end="2007-12-31" />
          <spell start="2009-01-01" end="2009-12-31" />
        </spells>
      </node>
    </nodes>
  </graph>
</gexf>
In this example, Node 1 exists in 2007 and 2009 but not in 2008. Important: Intervals cannot overlap within spells - each spell must be separate and non-overlapping.
Spells with Timestamps
<?xml version="1.0" encoding="UTF-8"?>
<gexf xmlns="http://gexf.net/1.3" version="1.3">
  <graph mode="dynamic" timerepresentation="timestamp" timeformat="date">
    <nodes>
      <node id="n1" label="Node 1">
        <spells>
          <spell timestamp="2007-01-01" />
          <spell timestamp="2008-06-15" />
          <spell timestamp="2009-12-31" />
        </spells>
      </node>
    </nodes>
  </graph>
</gexf>
In this example, Node 1 exists at three specific points in time.
Note: If spells are provided on an element, any start, end, or timestamp attributes directly on that element will be ignored.
Dynamic weight
Normally an edge's weight is directly defined in the edge element with a particular value. Defining a dynamic weight attribute overrides this value and provides dynamic weight support.
The rule is to define an edge attribute with the weight keyword for identifier. Then, use multiple 'attvalue' like explained above to set different values over time.
<attributes class="edge">
   <attribute id="weight" title="Weight" type="float"/>
</attributes>
Transform existing column in Time Interval
Imagine a social network where each node represents a friend of yours and one of the attribute columns is the date you met. In order to transform this column into a dynamic interval take the following steps:
- Step 1: Click on Merge Columns manipulator in the Data Laboratory.

- Step 2: From the available columns on the left, add the column or columns (if you have both a start and end period) you want to use to create the time interval. Then select Create time interval from the available merge strategies.
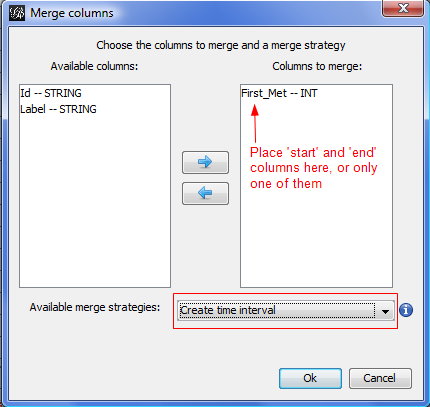
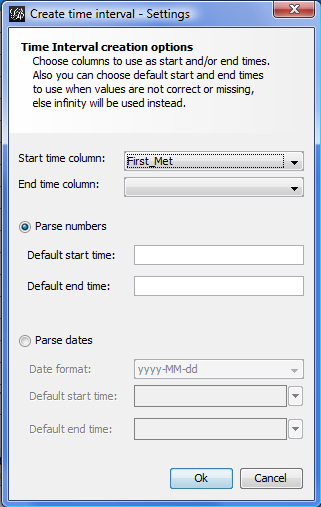
- Step 3: Select which column is the start and which is the end (or leave this blank if no end exists). If the column is numerical (integer, float, double), select Parse numbers. If the data are date strings, they can also be parsed and transformed into a time interval. Our 'First Met' column is just the day in the year, just a number.
Import Multiple Static Files as Dynamic Graph
Starting with Gephi 0.9.1, you can create a dynamic network by importing multiple static "snapshot" files, where each file represents the network at a different point in time. This is useful when you have separate files for different time periods and want to see how the network evolves.
Using "Slice" Mode with Timestamps
The key to this approach is using the mode="slice" attribute in your GEXF files, along with timerepresentation="timestamp" and a timestamp attribute on the graph element. Each file represents the network at a specific timestamp.
Example: Three Network Snapshots
Here are three GEXF files, each representing the network at a different timestamp:
File 1: network_t1.gexf (timestamp=1)
<?xml version="1.0" encoding="UTF-8"?>
<gexf xmlns="http://gexf.net/1.3" version="1.3">
  <graph mode="slice" defaultedgetype="directed" timerepresentation="timestamp" timestamp="1">
    <nodes>
      <node id="n0" label="Bob"/>
      <node id="n1" label="Jack"/>
    </nodes>
    <edges>
      <edge weight="1" source="n0" target="n1"/>
    </edges>
  </graph>
</gexf>
File 2: network_t2.gexf (timestamp=2)
<?xml version="1.0" encoding="UTF-8"?>
<gexf xmlns="http://gexf.net/1.3" version="1.3">
  <graph mode="slice" defaultedgetype="directed" timerepresentation="timestamp" timestamp="2">
    <nodes>
      <node id="n0" label="Bob"/>
      <node id="n1" label="Jack"/>
      <node id="n2" label="Sue"/>
      <node id="n3" label="Beth"/>
    </nodes>
    <edges>
      <edge weight="1" source="n0" target="n1"/>
      <edge weight="1" source="n3" target="n2"/>
    </edges>
  </graph>
</gexf>
File 3: network_t3.gexf (timestamp=3)
<?xml version="1.0" encoding="UTF-8"?>
<gexf xmlns="http://gexf.net/1.3" version="1.3">
  <graph mode="slice" defaultedgetype="directed" timerepresentation="timestamp" timestamp="3">
    <nodes>
      <node id="n0" label="Bob"/>
      <node id="n1" label="Jack"/>
      <node id="n2" label="Sue"/>
      <node id="n3" label="Beth"/>
    </nodes>
    <edges>
      <edge weight="1" source="n1" target="n2"/>
      <edge weight="1" source="n3" target="n0"/>
    </edges>
  </graph>
</gexf>
Importing Slice Files in Gephi
To import these files:
- Open Gephi and go to File > Open
- Select all the slice files you want to import (you can select multiple files)
- In the Import report, select the Merge option
- Click OK
Gephi will merge all the slices into a single dynamic graph. The result is a longitudinal network where:
- Nodes and edges have time intervals based on when they appear in the different snapshots
- All attributes become dynamic attributes
- Edge weights are also dynamic
Important Notes
- Node identifiers must be exactly the same across files to be recognized as the same node
- Use mode="slice" in each file
- Set timerepresentation="timestamp" in each file
- Each file must have a different timestamp value on the graph element
- You can use different time formats (double, date, dateTime) - just ensure consistency across all files
- You can also use intervals by setting timerepresentation="interval" and using interval bounds instead of a single timestamp
- Start with an empty workspace when importing to avoid conflicts
Summary: Choosing the Right Approach
Here's a quick guide to help you choose the best method for your dynamic network:
| Scenario | Recommended Approach |
|---|---|
| You have one file with all dynamic data already defined | Use a single GEXF file with mode="dynamic" and choose interval or timestamp representation |
| You have multiple snapshot files (one per time period) | Use multiple GEXF files with mode="slice" and import them together with the Merge option |
| You have static data with time columns | Import the static file and use the Merge Columns manipulator in Data Laboratory |
| Your data represents durations or periods of existence | Use timerepresentation="interval" with start/end attributes |
| Your data represents discrete moments or observations | Use timerepresentation="timestamp" with timestamp attributes |
| You need an element to exist at multiple non-contiguous times | Use the spells element with multiple spell entries |
Remember: You cannot mix interval and timestamp representations in the same graph - choose one and use it consistently throughout your data.